
Rising diesel prices lift freight rates
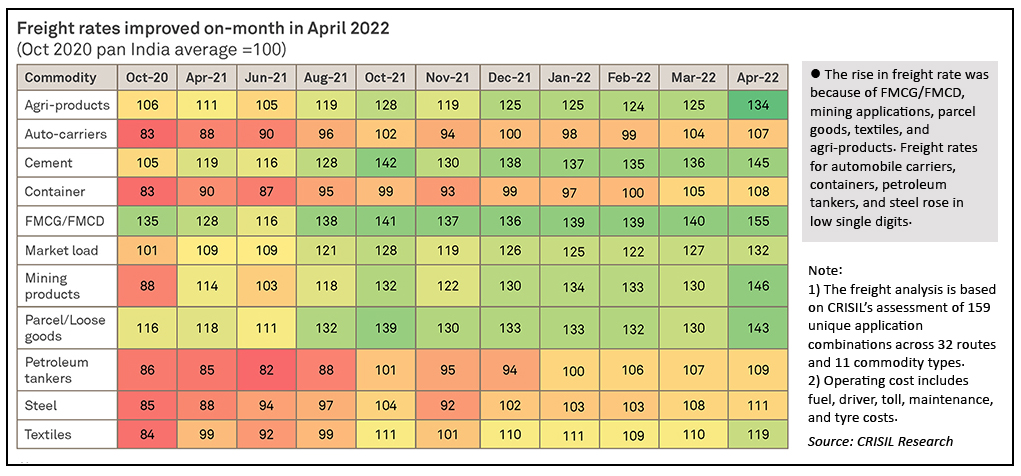
In April, transporters passed on higher diesel prices by raising freight rates on several routes.
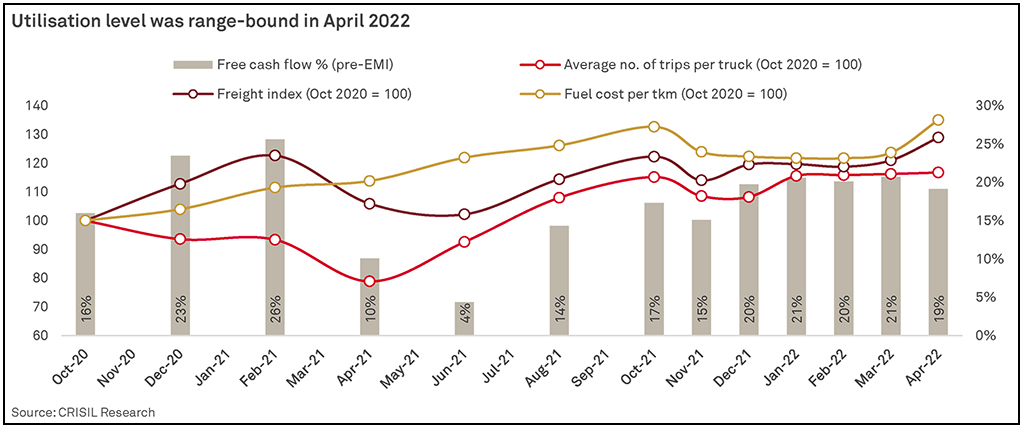
However, fleet utilisation was flat on-month. While there was higher utilisation for agri-products, cement, mining (largely coal and iron ore), and parcel/loose goods, this was offset by slightly lower utilisation for auto-carriers, market load, and steel.
Utilisation remained unchanged for fast moving consumer goods (FMCG)/ fast moving consumer durables (FMCD), containers, textiles, and petroleum tankers.
CRISFrex shows freight rates rose on-month. However, free cash flow (FCF; pre-equated monthly instalment) decreased 200 basis points on-month, largely because of the fuel price rise. Higher operating cost constrained the ability of transporters to generate higher — or maintain — cash flows compared with last month.
CRISFrex and FCF signals
Fleet utilisation for agri-products, cement, mining (largely coal and iron ore), and parcel/loose goods improved onmonth in April, whereas it declined for automobile carriers, market load, and steel. For FMCG/FMCD, containers, textiles, and petroleum tankers it was flat.
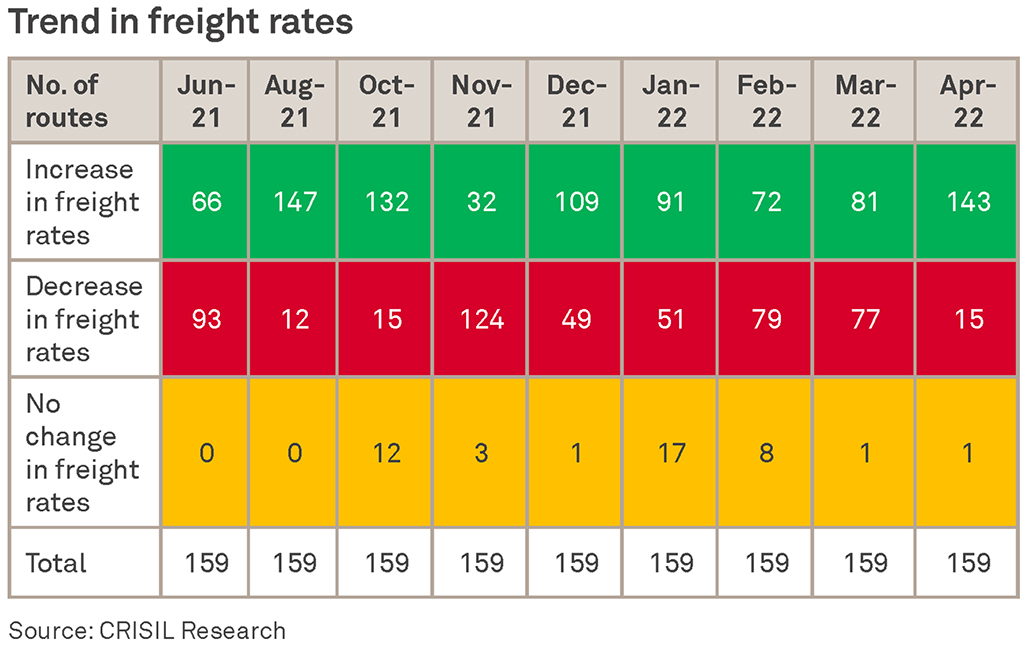
But freight rates for all commodities rose on-month. Freight rates for consumer essentials such as FMCG/FMCD, loose goods, and mining applications rose sharply, with rates for discretionary goods such as automobiles and textiles also improving on-month.
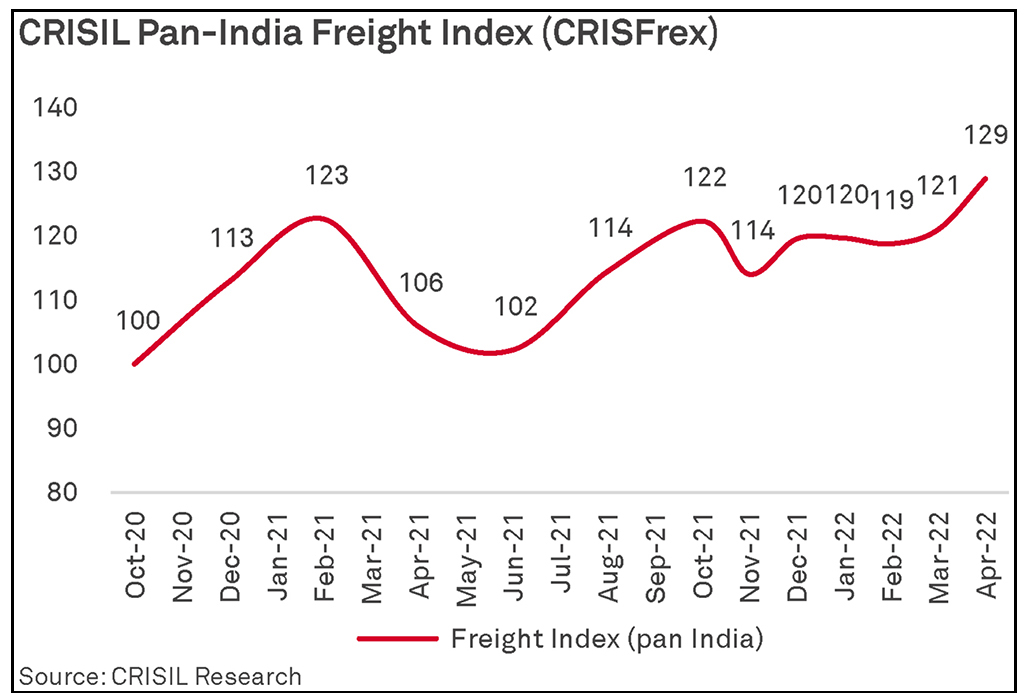
This translated into the CRISFrex rising on-month to 129 in April 2022 from 121 in March 2022.
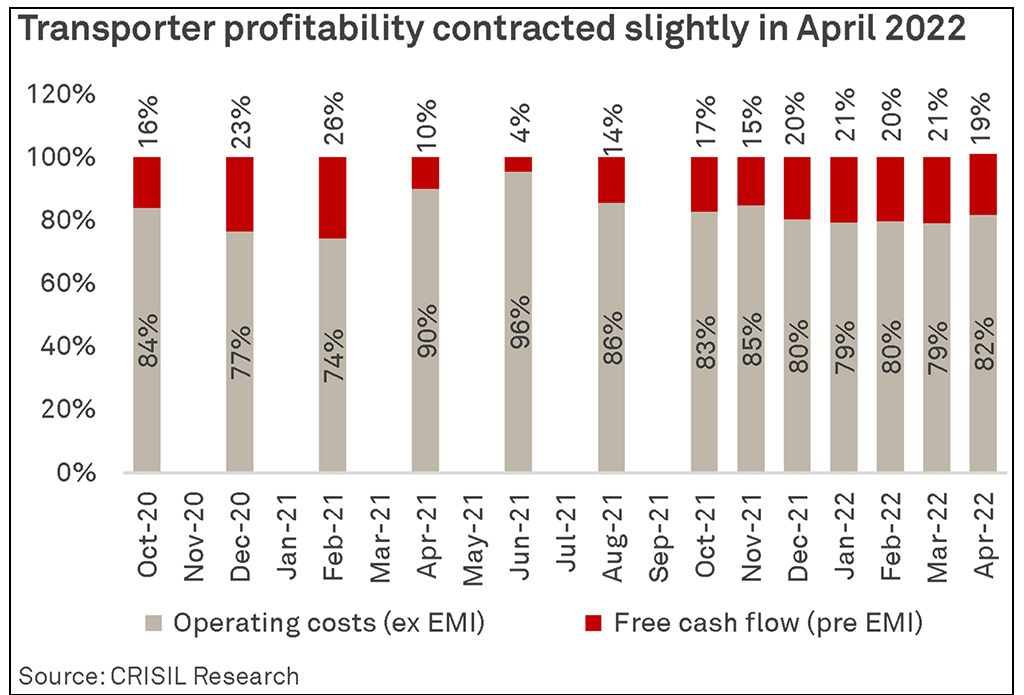
Flat utilisation levels, uptick in freight rates, and increase in diesel prices resulted in the industry’s FCF falling to ~19% in April 2022 vis-à-vis ~21% in March 2022.
However, given the geopolitical developments, it is imperative to continue to track diesel prices as market dynamics could change rapidly.
Methodology
CRISIL incorporates views of 100-150 transporters to understand freight dynamics as well as operational aspects, such as number of trips undertaken and key cost heads (fuel, driver, toll, tyre, and maintenance).
This exercise is conducted on a closed sample of 159 route-commodity combinations, spanning 32 routes, 11 commodity types, and five truck platforms with differing load bodies, depending on the commodity carried.
CRISIL’s analysis provides an aggregated view of inputs collected to arrive at a holistic picture pertaining to the overall trucking scenario in India.